Stripy 2.0 released
Generating Voronoi diagrams and interpolating / smoothing with spline tensions are among a list of new features in Stripy 2.0

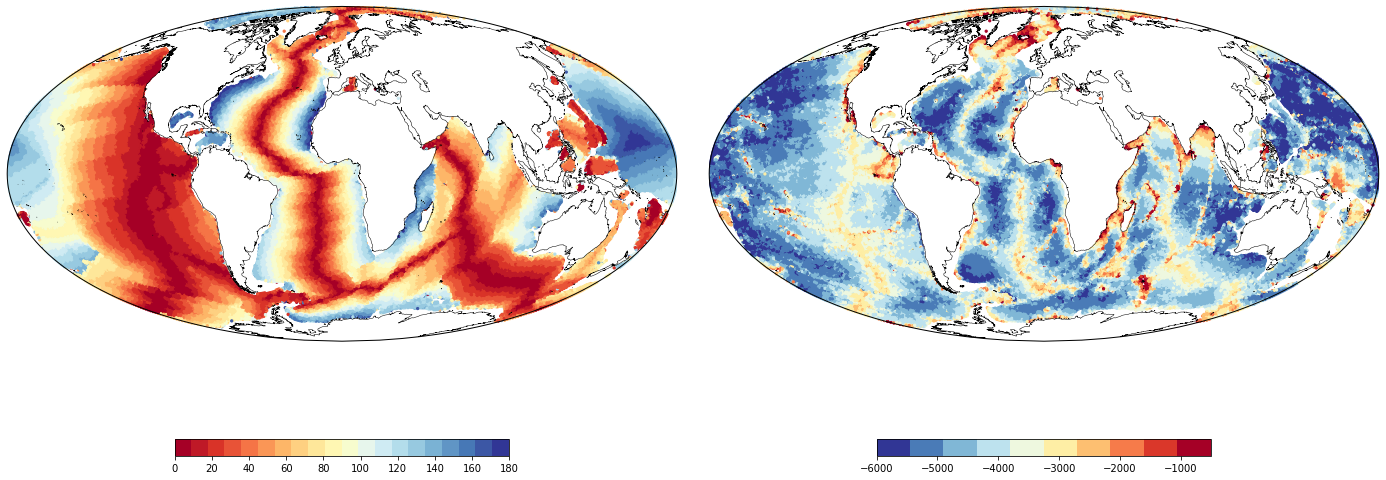
We've been busy creating the next major release of Stripy. To refresh your memory, Stripy is a Python tool for triangulating scattered points either in Cartesian coordinates or on the sphere. It wraps a bunch of Fortran codes in a neat, object-oriented Python interface that can be used for many geographical applications.
What's new?
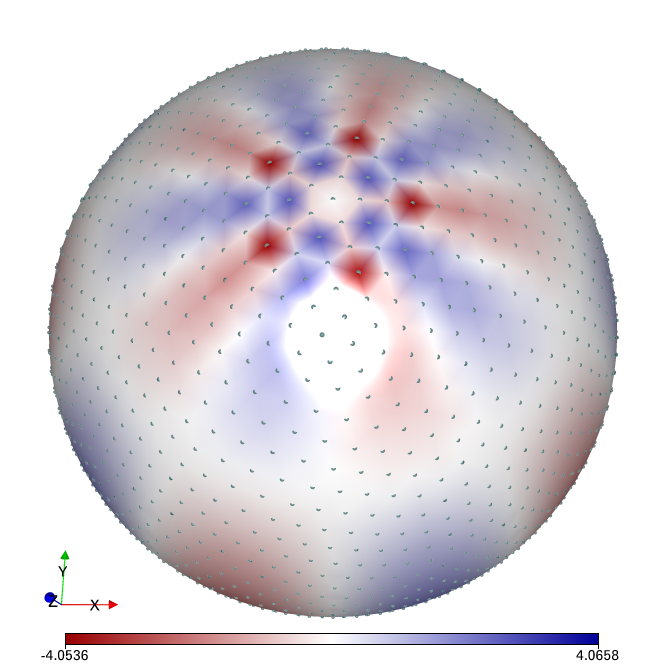
Spline tension - a lot of data transformations in Stripy are underpinned by cubic splines (e.g. interpolation, derivatives, smoothing). In v2.0 you can now add spline tension which avoids overshoot / undershoot artefacts. The most visible improvements are in accuracy of derivatives at points along the boundary and extrapolation of data beyond the boundary of a mesh.
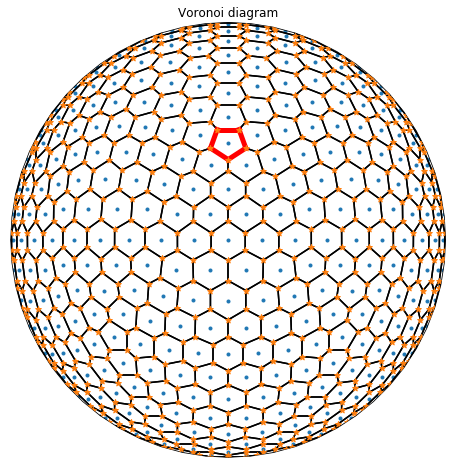
Voronoi diagram - the Voronoi diagram is the dual of a Delaunay triangulation. For every triangle in the mesh, there is a voronoi point which lies at an equal radius from each node. The diagram is constructed by connecting up the voronoi points from each neighbouring triangle.
Other notable new features include:
- a new equispaced elliptical mesh in Cartesian coordinates
- central area node weights for any mesh
- efficient evaluation of second derivatives in Cartesian coordinates
- better documentation, LGPLv3 license, and other small bug fixes
You can install the latest release of Stripy with pip
pip install stripyor Conda:
conda install -c underworldcode stripyMake Stripy better!
We welcome contributions to the code. If you want to add something you think is missing in Stripy, submit a pull request and if it looks good we'll merge your changes. Check out our contribution guidelines for more details.


Comments ()